Most transport operations are leaking money in ways their own reporting systems will never surface. Estimates from industry analysts suggest that between 15% and 30% of total logistics costs are attributable to inefficiencies that sit beneath standard KPI dashboards, including suboptimal routing assumptions, poor load utilisation, and fleet allocation decisions that made sense three years ago but no longer reflect actual demand patterns. Before you commit budget and operational disruption to any optimisation programme, you need to quantify transport costs with precision, not estimates. This article explains exactly how to do that.
Table of Contents
- Quick Takeaways
- Why Standard Reporting Fails to Reveal Real Cost Leaks
- What Hidden Logistics Costs Actually Look Like in Practice
- The Transport Cost Audit Process: A Step-by-Step Breakdown
- Comparing the Three Main Approaches to a Transport Cost Audit
- Common Mistakes Operations Directors Make Before Any Optimisation Programme
- How Live Operational Data Changes What You Find
- Frequently Asked Questions
- References
Quick Takeaways
| Key Insight | Explanation |
|---|---|
| Standard TMS reports mask the real problem | Transport management systems report on what happened, not on the decision logic that caused it. Cost leaks hide in planning rules, not in the data output. |
| Load utilisation is the most commonly underestimated cost driver | Operations teams often track average load fill but rarely measure the cost of avoidable partial loads on specific lane types or time windows. |
| Route assumptions go stale faster than most firms realise | Routing logic built for one demand pattern continues running long after customer volumes, locations, or service windows have shifted significantly. |
| A cost audit must test decisions, not just data | Quantifying hidden logistics costs requires examining the planning rules and allocation logic that produce outcomes, not simply reviewing cost-per-mile averages. |
| Live deployment reveals what modelling cannot | Simulations and desktop analyses consistently undercount real savings because they cannot capture the behavioural and operational variables present in a live system. |
| The savings threshold matters before you start | If an audit cannot credibly identify a minimum of six-figure annual savings, it is unlikely the optimisation programme will generate positive ROI after implementation costs. |
| Auditing should create zero operational disruption | Any cost quantification process that requires system replacement or changes to live operations during the audit phase will produce distorted and unreliable findings. |
Why Standard Reporting Fails to Reveal Real Cost Leaks
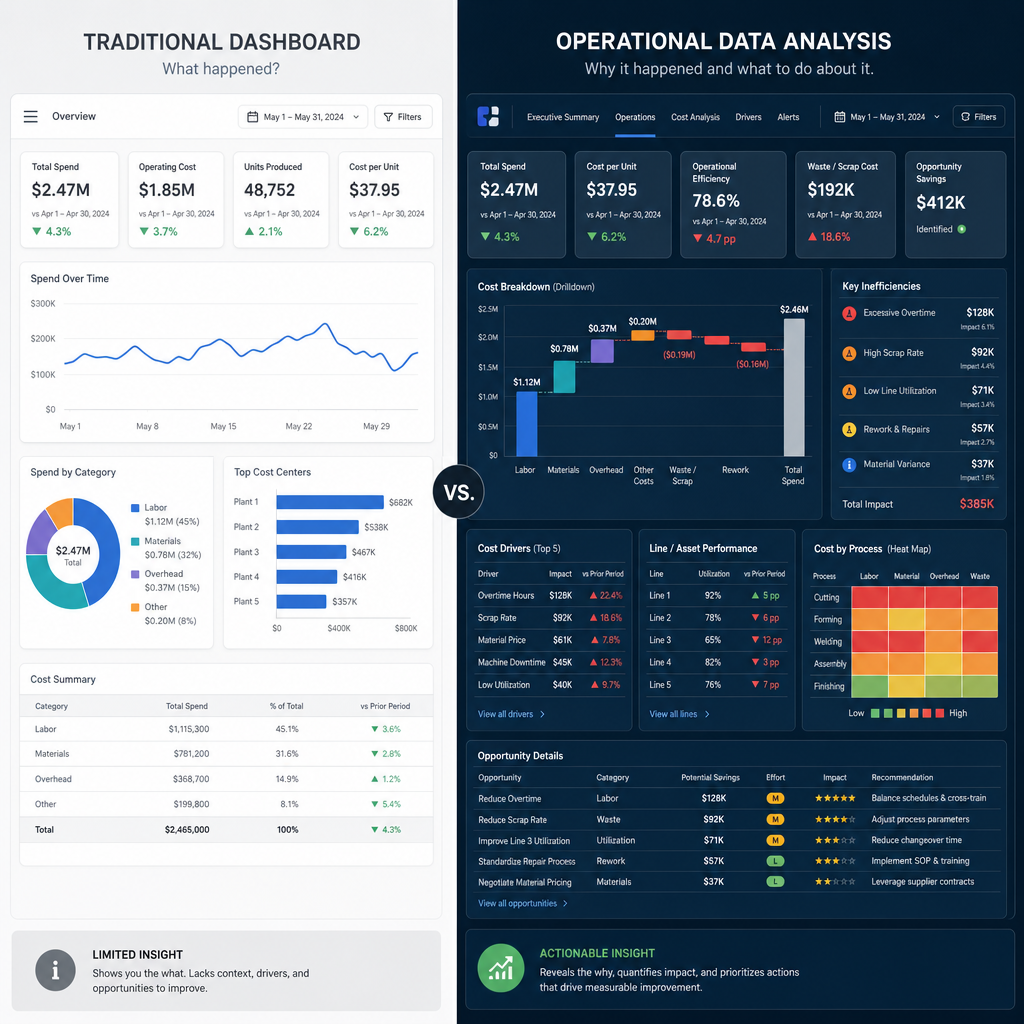
The vast majority of transport reporting is built around accountability, not discovery. Your TMS can tell you what your cost-per-kilometre was last month. It cannot tell you how much you would have saved if your fleet allocation logic had accounted for the demand shift that happened six months ago.
This is the fundamental problem. Standard reporting is retrospective and descriptive. It confirms what occurred. It does not interrogate why planning decisions produced the outcomes they did, or whether different decisions would have been materially cheaper.
In practice, this means that operations teams working from dashboards and weekly cost summaries are looking at symptoms, not causes. A slight increase in cost-per-delivery might reflect driver behaviour, or it might reflect a routing assumption that is sending vehicles on a pattern that made sense under a previous customer footprint. The dashboard will not tell you which it is.

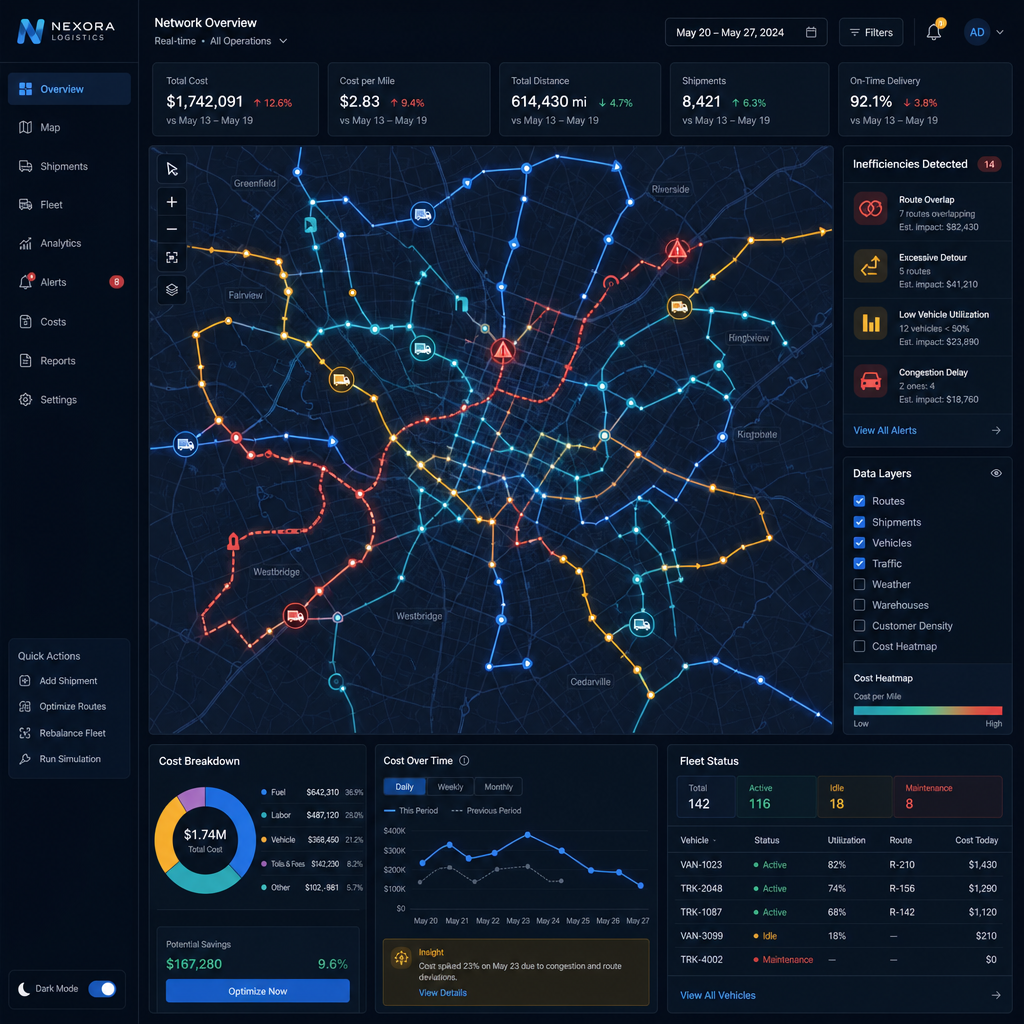
The data consistently shows that when transport cost audits go below surface-level reporting, the largest savings are almost never where management expected them to be. Fleet size assumptions, fixed route structures, and load consolidation rules tend to be the biggest contributors, and none of these show up clearly in a standard cost report.
Pro tip: Before commissioning any optimisation programme, ask your team to map out every planning rule that currently governs fleet allocation and routing. If those rules cannot be articulated clearly, they are almost certainly generating costs that nobody has yet quantified.
What Hidden Logistics Costs Actually Look Like in Practice
The phrase “hidden logistics costs” can sound abstract until you see specific examples. These are not rounding errors or minor inefficiencies. They are structural cost patterns that compound across hundreds or thousands of trips per year.
Fleet Allocation Logic That No Longer Reflects Demand
Many fleets were sized and allocated under demand conditions that have since changed. A common pattern is a fleet that was structured for a customer mix with heavy peak-to-trough variability, which has since smoothed out, but the standby vehicle policies and shift structures were never updated. The cost of maintaining that buffer is real, it just does not appear as a line item labelled “legacy over-provision.”
Routing Assumptions Built on Outdated Geography
Route optimisation tools are only as good as the parameters they were configured with. When customer locations shift, when delivery windows change, or when new depot infrastructure comes online, the routing logic often does not update to reflect those changes automatically. The result is vehicles running patterns that are measurably suboptimal but look reasonable in isolation.
Load Utilisation Gaps on Specific Lanes
Aggregate load fill figures are almost always misleading. An operation reporting 82% average load utilisation might have 40% fill rates on specific lanes during specific windows, and those lanes might account for a disproportionate share of total kilometres driven. Hidden logistics costs frequently concentrate in a minority of lanes or time windows that aggregate averages obscure entirely.
“The challenge with transport cost visibility is not data availability. It is decision auditability. Most operations have more data than they can act on, but almost no visibility into whether their planning logic is optimal.” Source: McKinsey Global Institute, research on logistics productivity and decision systems.
The Transport Cost Audit Process: A Step-by-Step Breakdown
A credible transport cost audit is not a data download and a spreadsheet exercise. It is a structured interrogation of the decisions that produce your cost base, carried out against live operational data.
Step 1: Map Every Planning Rule Currently in Use
Before touching any cost data, document the logic that governs your operation. Which vehicles are allocated to which routes under which conditions? What triggers a load consolidation decision versus a split delivery? What are the assumptions embedded in your current route structures? This step alone often surfaces rules that nobody in the current team can fully explain, which is itself a significant finding.
Step 2: Identify the Decision Points That Drive the Highest Cost Variance
Not all planning decisions carry equal financial weight. A good audit identifies the specific decision types, fleet allocation, load build rules, routing parameters, where different choices would produce materially different cost outcomes. This is not about finding errors. It is about finding where the gap between current decisions and optimal decisions is largest.
Step 3: Deploy Measurement Against Live Operations
This is where desktop analysis fails and live data collection succeeds. Quantifying hidden transport costs accurately requires measuring what actually happens in your operation, not what your system records happened. Driver behaviour, real dwell times, actual load configurations, and genuine route execution all differ from system records in ways that matter significantly to the final cost calculation.
Flow Dynamics deploys proprietary hardware within live transport systems for exactly this reason. A five-day live data collection period captures the operational reality that no TMS export or modelling exercise can replicate.
Step 4: Calculate the Annualised Cost of Each Identified Inefficiency
Each identified cost leak must be converted into an annualised figure based on actual operational frequency, not worst-case estimates. A routing inefficiency that costs an additional 40 minutes per trip matters very differently if it affects 10 trips per week versus 200. Annualisation is the step that converts findings into a credible business case.
Pro tip: Require any audit partner to present their savings figures as annualised projections based on your actual operational data, not benchmark comparisons to industry averages. Industry averages obscure the specific inefficiencies in your operation and routinely produce savings estimates that do not materialise after implementation.
Comparing the Three Main Approaches to a Transport Cost Audit
There are three broadly used approaches to quantifying transport costs before an optimisation programme. Each has a different accuracy profile and a different risk level for the business commissioning the work.
| Approach | What It Measures | Key Limitation |
|---|---|---|
| Desktop benchmarking (e.g., routeoptimization.com-style analysis) | Compares your cost-per-unit metrics against industry benchmarks to identify apparent gaps | Benchmarks reflect average operations, not your specific planning logic, customer footprint, or network configuration. Savings projections are frequently overstated. |
| TMS data export and modelling (e.g., consultancies like sccgltd.com or scalagroup.co.uk) | Uses historical system data to model alternative routing or fleet configurations | Models are only as accurate as the system data, which often differs materially from operational reality. Decision logic embedded in planning rules is rarely captured. |
| Live operational data deployment (Flow Dynamics approach) | Captures actual operational behaviour, load configurations, and routing execution against live decision logic over a defined period | Requires deploying hardware into a live operation, but produces findings that reflect operational reality rather than system records or theoretical models. |
The pattern across these approaches is clear. The further removed an audit method is from live operational reality, the higher the probability that its savings projections will not be realised after implementation. Desktop benchmarking is the weakest form of pre-commitment quantification. Live data deployment is the most reliable, and the only one that can credibly underpin a no-savings, no-fee guarantee.
Common Mistakes Operations Directors Make Before Any Optimisation Programme
Having worked through transport cost audits across multiple fleet types and network configurations, the same mistakes appear repeatedly at the pre-commitment stage.
Accepting Vendor Savings Projections Without an Independent Baseline
Technology vendors and route optimisation software providers have a structural incentive to present the largest plausible savings figure. Without an independent baseline built from your live operational data, there is no reliable way to assess whether those projections are credible. A common mistake is treating vendor demonstrations as evidence of savings potential rather than as marketing material.
Optimising the Wrong Variable
Operations that focus an optimisation programme on cost-per-kilometre without first auditing load utilisation and fleet allocation often find that their programme generates modest efficiency gains while the real cost drivers remain untouched. The variable that is easiest to measure is rarely the variable that drives the most cost.
Committing to System Replacement Before Quantifying Decision Logic Costs
Many costly TMS replacement programmes are initiated because management assumes that better reporting will surface and solve the underlying cost problems. In practice, the issue is almost never the reporting system. It is the planning logic that the system is executing. Replacing the system without changing the logic simply produces the same costs with a new interface.
Flow Dynamics specifically focuses on decision-making problems rather than reporting problems for exactly this reason. The cost savings in most transport operations come from changing what decisions are made, not from getting better visibility of the same decisions.
How Live Operational Data Changes What You Find
The gap between what a TMS records and what actually happens in an operation is consistently larger than operations directors expect. Dwell times recorded in the system are often significantly shorter than actual dwell times. Load configurations recorded at departure do not always reflect what vehicles actually carry. Route adherence rates that look acceptable in aggregate often conceal significant deviations on specific runs.
None of this is a criticism of the teams running these operations. It is simply a reflection of the fact that live operational data and system records are two different things, and any audit that relies exclusively on system records will produce findings that undercount the real cost opportunity.
The practical implication is that a five-day live data deployment, using hardware that captures what is actually happening rather than what the system records, will consistently identify a larger and more accurate set of cost savings than any desktop or modelling exercise carried out on the same operation.
This is why the minimum savings threshold matters as a design principle, not just as a commercial guarantee. If a credible live audit cannot identify at least £100,000 in annualised savings, the operation is either already highly optimised (rare) or the audit methodology is not capturing the full picture.
Pro tip: When evaluating any audit methodology, ask specifically what the process does to reconcile system-recorded data against actual operational behaviour. If there is no answer to that question, the methodology is working exclusively from TMS exports and will undercount real savings.
Frequently Asked Questions
What does it actually mean to quantify transport costs rather than just measure them?
Measuring transport costs means capturing what you spend. Quantifying them means calculating the gap between what you currently spend and what you would spend if your planning decisions were optimised. The second number is what matters before committing to any programme, and it requires understanding your decision logic, not just your cost reports.
How long does a credible transport cost audit take?
A desktop or benchmarking exercise can be done in days, but its findings are too unreliable to base a major optimisation commitment on. A live operational data deployment of five to seven days is sufficient to capture enough operational reality to produce savings projections that will hold up after implementation. Anything shorter than that in a live environment is likely to miss significant cost patterns.
What is the most common source of hidden logistics costs in a mid-size fleet operation?
In practice, the most common sources are fleet allocation logic that was designed for a previous demand pattern, route structures that have not been reconfigured after customer footprint changes, and load consolidation rules that optimise for simplicity rather than cost efficiency. These three areas account for the majority of identified savings in most audits conducted against live operational data.
Can you quantify transport costs without replacing or disrupting your current TMS?
Yes, and this is an important point. The audit process should work alongside your existing systems, not replace them. The goal is to understand the cost implications of the decisions your current planning logic is making, which does not require any system change. If an audit provider tells you that you need to replace or significantly modify your TMS before they can assess your costs, that is a signal that their methodology is system-dependent rather than operationally grounded.
How do you know whether a savings projection from an audit is credible?
A credible savings projection should be built from your specific operational data, annualised based on actual trip frequencies, and presented as a range with conservative and realistic scenarios rather than a single optimistic figure. It should also identify the specific planning decisions or rules that are generating each component of the projected saving. Any projection that cannot be traced back to specific decision logic in your operation should be treated with significant scepticism.
What is the difference between a transport cost audit and a route optimisation analysis?
A route optimisation analysis looks at whether your vehicle routes are efficient. A transport cost audit is broader, examining fleet allocation logic, load utilisation, route structures, planning rules, and the interaction between all of these. Route efficiency is one component of total transport cost, but it is rarely the only significant one, and in many operations it is not even the largest one.
If you are currently working through a pre-commitment assessment for a transport optimisation programme, share what you have found to be the most difficult cost to surface in your own operation. The specifics are genuinely useful for others facing similar decisions.
References
- McKinsey Global Institute research on logistics productivity, supply chain efficiency, and decision system performance
- Statista data on global logistics costs, fleet management expenditure, and transport sector benchmarks
- Forbes analysis of supply chain cost management, fleet optimisation investment, and operational efficiency strategies
- UK Government Department for Transport statistics on freight operations, fleet utilisation, and road haulage cost structures