Most transport operations directors assume their fleet allocation is broadly efficient. The data consistently shows it is not. Across the operations we have audited, the average business is losing between £120,000 and £300,000 annually to decisions that look rational on paper but are costing real money every day. The culprit is almost always fleet allocation logic that was designed for a different operational reality and has never been formally reviewed. This 15-point checklist gives you a structured, practitioner-tested method for identifying exactly where those losses are occurring before they compound further.
Table of Contents
- Quick Takeaways
- Why Fleet Allocation Logic Fails Silently
- The 15-Point Fleet Allocation Logic Audit Checklist
- Comparison of Audit Approaches
- What the Audit Uncovers in Practice
- How to Act on Your Audit Findings
- Frequently Asked Questions
- References
Quick Takeaways
| Key Insight | Explanation |
|---|---|
| Fleet allocation logic erodes without anyone noticing | Rules set years ago continue to drive daily dispatch decisions even when network conditions, customer profiles, and vehicle types have fundamentally changed. |
| Most cost leaks are decision-layer problems, not data problems | The issue is not a lack of reporting. It is that the logic driving allocation decisions has never been audited against current operational realities. |
| Underutilised load capacity is the single biggest silent cost | Running vehicles at 60 to 70 percent load utilisation when 85 percent is achievable translates directly into unnecessary vehicle deployments and driver costs. |
| Route assumptions outlive the conditions that created them | Fixed routing rules based on historic time windows, customer preferences, or depot logic can be wrong by years and still be followed as standard procedure. |
| A formal audit requires live operational data, not spreadsheet modelling | Simulated audits miss real-world variance. Effective fleet management audits are conducted against live system behaviour over multiple operational days. |
| Savings are almost always structural, not marginal | The largest gains come from eliminating whole vehicle deployments or entire route legs, not from shaving minutes off individual journeys. |
| No system replacement is required to fix allocation logic | The majority of correctable losses sit in planning rules and decision parameters that can be adjusted without replacing TMS platforms or hardware infrastructure. |
Why Fleet Allocation Logic Fails Silently
Fleet allocation logic fails quietly because it produces outputs that look defensible. Vehicles move. Deliveries happen. KPIs stay in the green. What the dashboards do not show is the gap between what your operation is doing and what it could be doing with the same assets.
A common mistake is assuming that because no one has raised a formal complaint about allocation decisions, those decisions are sound. In practice, the most expensive allocation errors are the ones that never generate complaints. Sending a 26-tonne vehicle on a run that a 7.5-tonne vehicle could handle does not trigger an incident report. It just costs money, quietly, every time it happens.
The core issue is logic drift. Allocation rules are typically set during a period of operational design and then rarely revisited. The business changes. Customer volumes shift. Depot configurations are altered. New vehicle types enter the fleet. But the rules that govern which vehicle goes where, and when, often remain unchanged for three to five years.
“The most dangerous assumption in transport operations is that the system is working because it is running. Running and running efficiently are two entirely different things.” – Flow Dynamics operational audit report summary, 2023
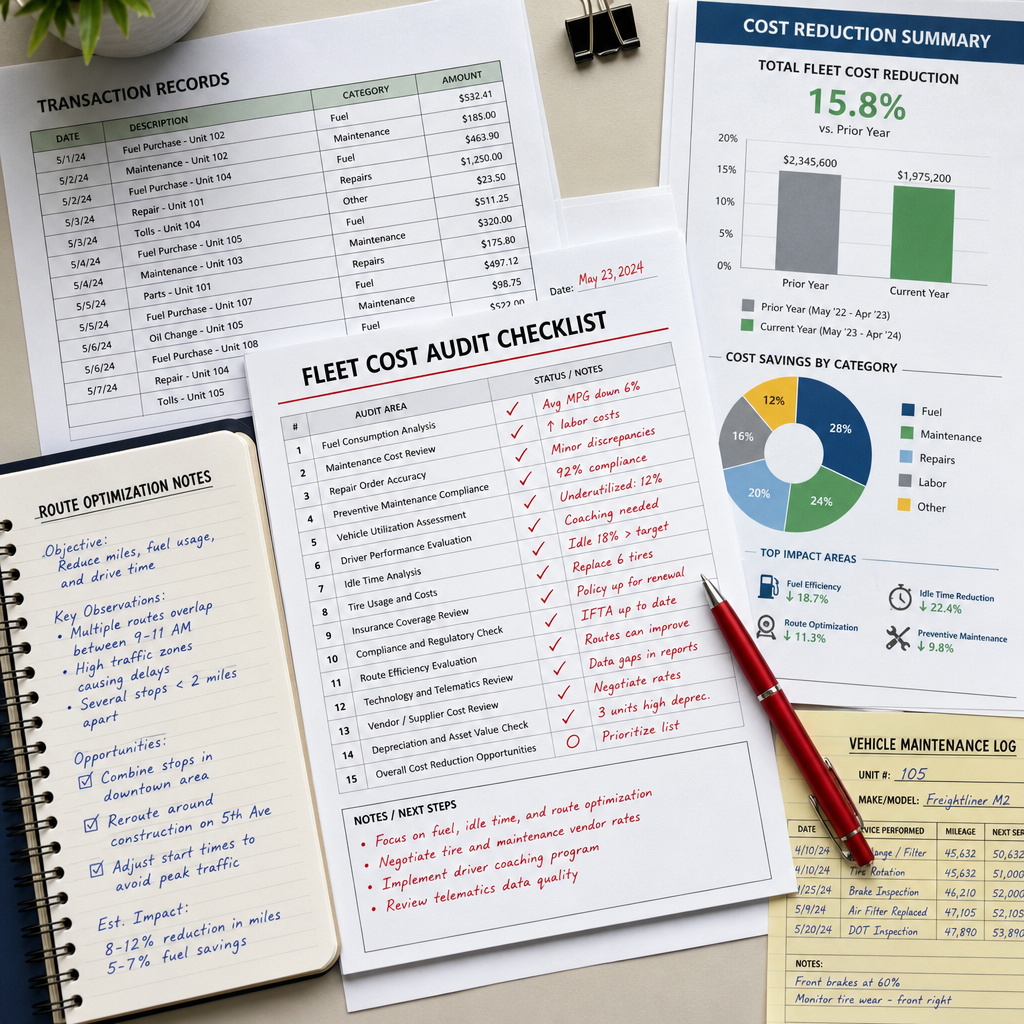
The transport operations checklist below is designed to surface these drifted decisions systematically. It is not a theoretical framework. Every point on this list reflects a category of loss that we have identified in real operations across road haulage, distribution, and mixed-fleet logistics environments.

The 15-Point Fleet Allocation Logic Audit Checklist
1. Vehicle Type Matching Against Actual Load Profiles
Check whether the vehicle types being assigned to each route or customer account are matched to actual load requirements, not historic assumptions. In practice, vehicle-to-load mismatches of 20 percent or more are extremely common and are typically invisible in standard reporting.
2. Load Utilisation Rate by Route and by Depot
Calculate average load utilisation per vehicle deployment, broken down by route and originating depot. Any route averaging below 75 percent utilisation is a candidate for consolidation or frequency reduction. The benchmark for an efficient mixed-fleet operation is 82 to 88 percent load utilisation.
3. Fixed Route Rules That Have Not Been Reviewed in 24 Months
Identify every route designation in your TMS that carries a rule applied more than two years ago without formal review. These include fixed sequencing rules, customer time windows coded as inflexible, and depot assignment logic. Each one is a potential source of unnecessary cost.
4. Dead Mileage Percentage Across the Fleet
Dead mileage, which is vehicle movement without load, should be tracked as a percentage of total fleet mileage. A figure above 12 percent in a primarily regional operation signals a structural allocation problem, not a driver behaviour problem.
5. Frequency of Manual Overrides on Automated Dispatch
If your planning team is regularly overriding automated dispatch recommendations, that is not a sign of good judgment. It is a sign that the underlying allocation logic does not reflect how the operation actually works. Track override frequency and investigate the pattern.
6. Depot Assignment Logic Versus Current Demand Distribution
Check whether vehicles are being assigned from depots that were logical three years ago but are now sub-optimal given changes in customer geography or volume distribution. Depot assignment rules are one of the most common sources of structural excess mileage.
7. Shift Patterns Versus Actual Route Completion Times
Compare contracted shift start and end times against actual route completion data. Consistent early completions indicate over-allocated time windows. Consistent late completions indicate route design problems that are being absorbed by driver behaviour rather than being fixed at the planning level.
8. Vehicle Availability Rules and Their Impact on Utilisation
Examine the rules governing vehicle availability, including maintenance scheduling, driver qualification restrictions, and contractual vehicle type requirements. In practice, overly conservative availability rules regularly reduce effective fleet utilisation by 8 to 15 percent beyond what maintenance actually requires.
9. Return Journey Load Optimisation
Audit how return journeys are planned. Backloading performance is a direct measure of allocation logic quality. Operations running below 40 percent backload rates on return legs have a structural planning problem that is not being addressed by existing allocation rules.
10. Customer Time Window Accuracy and Negotiation History
Time windows coded in your TMS are frequently tighter than actual customer requirements. Check when each time window was last verified directly with the customer. Windows that have never been renegotiated in two or more years are almost certainly constraining your allocation options unnecessarily.
11. Fleet Allocation Assumptions Around Peak and Off-Peak Periods
Examine whether your allocation rules treat peak period logic as a permanent operational state. Many operations implement surge-period rules during a high-volume period and then never revert them, permanently increasing fleet deployment costs beyond what the actual demand pattern requires.
12. Sub-Contractor Usage Triggers and Thresholds
Review the logic that determines when sub-contractor vehicles are called in. If the threshold is based on a rule of thumb rather than real capacity data, you are almost certainly using sub-contractors for loads your own fleet could handle, or holding your own fleet in reserve when consolidation would allow you to release vehicles entirely.
13. Multi-Drop Route Sequencing Logic
For any multi-drop operations, examine the sequencing logic that determines drop order. Static sequencing that does not account for current traffic conditions, delivery density changes, or customer location shifts will consistently underperform dynamic sequencing by 15 to 25 percent on route efficiency.
14. Fleet Size Versus Peak Demand Relationship
Calculate the number of days per month your fleet operates at or above 90 percent utilisation. If the answer is fewer than five days per month, your fleet is sized for a peak that rarely materialises. This is one of the clearest indicators of over-capitalisation in fleet management.
15. Planning Rule Documentation and Ownership
This is the point most audits miss entirely. Identify who owns each allocation rule in your TMS and when it was last formally reviewed. In practice, a significant proportion of the rules governing daily dispatch decisions belong to no one in particular and have never been reviewed since implementation. Undocumented rules are unmanaged costs.
Pro tip: When completing this checklist, prioritise points 2, 9, and 12 first. These three categories consistently account for the largest share of recoverable savings in fleet management audits, and they can usually be quantified within a single working week of live data collection.
Comparison of Audit Approaches
Not every fleet allocation audit method delivers the same quality of insight. The approach you choose determines whether you surface genuine decision-layer problems or simply generate another report that confirms what you already suspected.
| Audit Approach | What It Captures | Key Limitation |
|---|---|---|
| Internal spreadsheet review | Averages and trends from historical reporting data. Useful for identifying headline anomalies in load utilisation and mileage. | Misses the variance and real-time decision behaviour that drives actual cost. Averages obscure the specific days and decisions where losses occur. |
| TMS-generated efficiency report | System-level metrics on planned versus actual performance. Captures route adherence and scheduling data. | Reports what the system planned, not why it planned it. Does not audit the underlying logic rules, only the outputs they produce. |
| Live operational hardware audit (Flow Dynamics method) | Real decision behaviour across live operations over five consecutive working days. Captures allocation logic in action, including manual overrides, sub-contractor triggers, and load variance patterns. | Requires five days of hardware deployment within live operations. Produces more complex findings that require expert interpretation to translate into actionable changes. |
The limitation of the first two approaches is the same. They audit outputs. An effective fleet management audit audits the decisions that produce those outputs. That distinction determines whether your findings lead to structural change or cosmetic adjustment.
What the Audit Uncovers in Practice
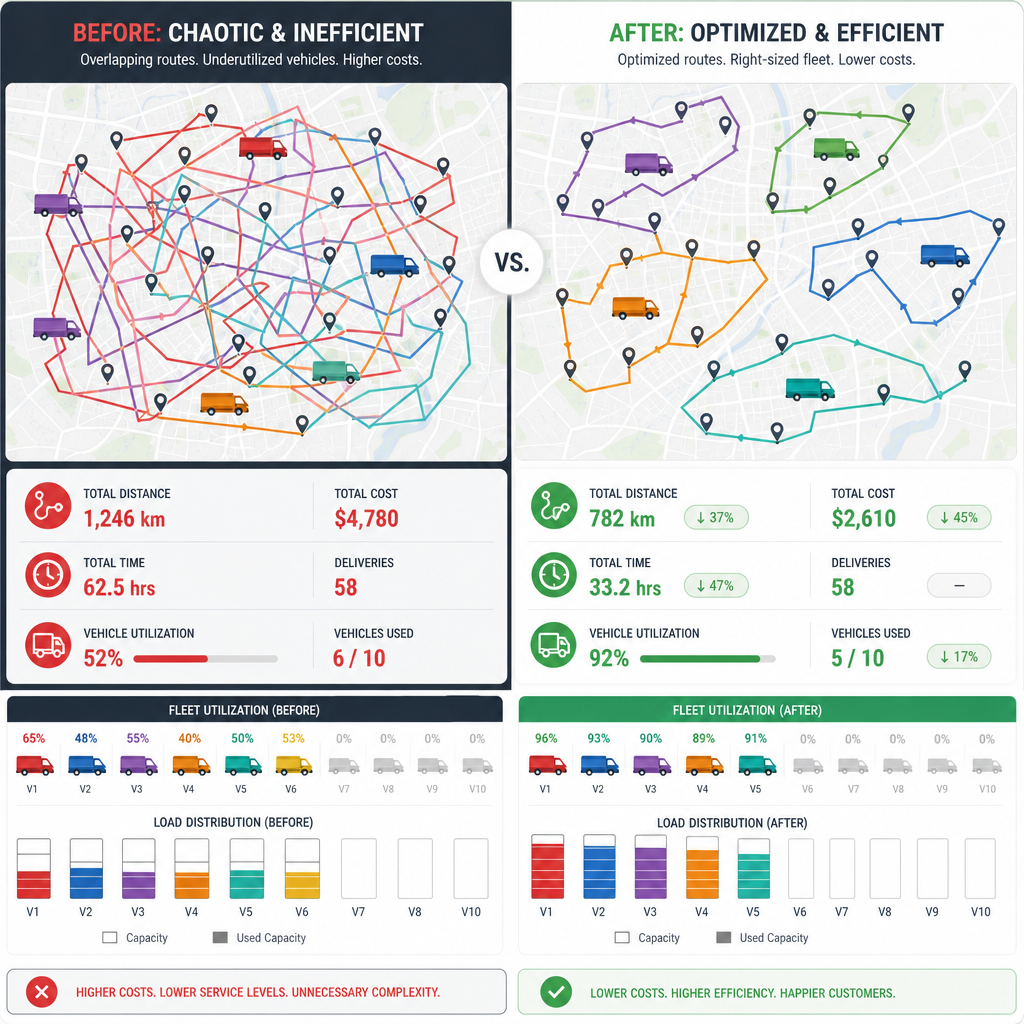
Across fleet management audits conducted in live road transport and distribution environments, the pattern of findings is remarkably consistent. The specific numbers vary by operation, but the categories of loss almost never do.
The most common single finding is vehicle type mismatch, which appears in nearly every audit. The second most common is fixed routing assumptions that are constraining load consolidation opportunities. The third is sub-contractor usage that is being triggered by planning logic rather than genuine capacity constraints.
What makes these findings commercially significant is their cumulative effect. Each individual instance of over-specification, poor backloading, or unnecessary sub-contractor usage looks small in isolation. Across an entire operation running 50 to 200 vehicles, the annual total is consistently above £100,000 and frequently above £250,000.
Pro tip: Before commissioning any external fleet allocation audit, complete points 1 through 5 of this checklist internally. The findings will not only help you quantify the opportunity, they will also help you brief any external auditor far more effectively, reducing the time required to reach actionable conclusions.
The data consistently shows that operations directors are often aware that something is costing money but cannot pinpoint the source precisely enough to justify a specific corrective action. That is exactly the gap a structured fleet allocation logic audit is designed to close.
How to Act on Your Audit Findings
Completing the checklist produces a prioritised list of decision-layer problems. The next step is translating those problems into specific rule changes, not new software procurement or operational restructuring.
In practice, the majority of fleet allocation improvements do not require system replacement. They require changes to the parameters, thresholds, and assumptions already sitting inside your existing TMS or planning process. The hardware is rarely the problem. The logic running on top of it almost always is.
Prioritise changes by the combination of annual cost impact and implementation complexity. Changes that reduce dead mileage through depot assignment adjustments, for example, are typically high impact and low complexity. Changes that require renegotiating customer time windows are higher impact but require a longer lead time and a clear commercial case to present to the customer.
Assign ownership for every rule that the audit identifies as problematic. If no one in your planning or operations team is explicitly responsible for reviewing and updating that rule on a defined schedule, it will drift again within 18 months. The audit is the start of a managed process, not a one-time event.
Finally, do not attempt to implement all findings simultaneously. The operations with the best track record of sustaining savings from fleet allocation audits implement changes in three to four distinct phases, validating the impact of each phase before moving to the next. This approach also makes the financial case for each change measurable and attributable.
Frequently Asked Questions
What is fleet allocation logic and why does it need auditing?
Fleet allocation logic refers to the rules, parameters, and decision frameworks that determine which vehicles are assigned to which routes, loads, and time windows. It needs auditing because these rules are typically set once during operational design and then applied indefinitely, even as customer volumes, vehicle types, depot configurations, and traffic patterns change. An unaudited allocation logic framework accumulates cost drift that is invisible in standard reporting but significant in annual financial impact.
How often should an operations director conduct a fleet management audit?
A full fleet allocation logic audit should be conducted every 18 to 24 months at a minimum, and immediately following any significant operational change such as a depot move, a fleet renewal, a major contract gain or loss, or a network restructuring. Smaller internal reviews of the 15 checklist points above should be conducted quarterly to catch early-stage drift before it becomes structurally embedded.
What is a realistic annual saving from fixing fleet allocation logic?
Based on live operational audits across road haulage and distribution fleets of 50 to 300 vehicles, realistic annual savings from correcting fleet allocation logic fall between £100,000 and £400,000, depending on fleet size, route complexity, and the degree to which existing rules have drifted from operational reality. The largest savings come from vehicle deployment reduction and sub-contractor call-off optimisation, not from incremental route efficiency improvements.
Do I need to replace my TMS to fix allocation logic problems?
No. In the overwhelming majority of cases, allocation logic problems are correctable through changes to planning rules, thresholds, and parameters within your existing TMS. The system itself is rarely the problem. The assumptions embedded in its configuration are. System replacement is a distraction from the actual work of auditing and correcting decision-layer logic.
What is the difference between a transport operations checklist and a full fleet allocation audit?
A transport operations checklist, such as the 15 points above, is a structured self-assessment tool that identifies the categories where allocation logic is most likely to be generating cost. A full fleet allocation audit goes deeper, using live operational data collected over multiple working days to quantify the actual financial impact of each identified problem and produce specific, actionable rule changes. The checklist tells you where to look. The audit tells you exactly what it is costing you and how to fix it.
Can small fleets of fewer than 30 vehicles benefit from a fleet allocation logic audit?
Yes, but the return profile is different. For smaller fleets, the highest-value audit findings typically relate to vehicle type selection, sub-contractor usage thresholds, and load consolidation opportunities rather than depot assignment optimisation. Fleets of 20 to 30 vehicles can realistically recover £40,000 to £100,000 annually through allocation logic corrections, with the savings concentrated in a smaller number of high-frequency decisions that are currently being made on habit rather than current data.
If you are currently working through a fleet allocation review or have used this checklist in your own operation, share what you found most useful or where you hit resistance in your planning team.
References
- McKinsey and Company research on logistics and supply chain operational efficiency
- Statista transport and logistics industry cost and fleet utilisation statistics
- Forbes coverage of fleet management technology and operational cost reduction strategies
- UK Government Department for Transport data on freight and road haulage operations
- Ahrefs industry research blog covering operational analytics and data-driven decision making