Most UK transport operations are losing money they cannot see on any standard report. The operational data consistently points to the same pattern: margin leakage is not coming from obvious failures like accidents, fines, or fuel spikes. It is coming from hidden transport costs UK operators treat as fixed overhead, when in reality they are the product of flawed decision logic embedded in planning rules, fleet allocation habits, and route assumptions that nobody has challenged in years. The numbers are rarely trivial. In our work deploying proprietary hardware inside live transport systems, the floor for uncovered savings is £100,000 annually, and that is a conservative starting point.
Table of Contents
- Quick Takeaways
- Why Standard Reporting Misses the Real Leaks
- Silent Cost Leak One: Fleet Allocation Logic
- Silent Cost Leak Two: Route Assumption Drift
- Silent Cost Leak Three: Load Utilisation Gaps
- Silent Cost Leak Four: Planning Rules Nobody Questions
- How a Fleet Cost Audit Surfaces What Your TMS Cannot
- Comparison of Approaches to Identifying Transport Margin Leakage
- Frequently Asked Questions
- References
Quick Takeaways
| Key Insight | Explanation |
|---|---|
| Fleet allocation is the largest silent cost driver | Assigning vehicles by habit rather than live demand logic routinely generates 15-25% excess capacity cost per route cycle. |
| Route assumptions calcify over time | Routes built around conditions that no longer exist, such as old depot locations or customer windows, become permanent cost fixtures unless actively audited. |
| Load utilisation below 78% is a red flag | Industry data suggests most operators running below this threshold are subsidising empty space at a cost that compounds across the full annual schedule. |
| Planning rules outlive their rationale | Rules written for a specific operational scenario, then never reviewed, silently constrain more efficient options that would otherwise be obvious. |
| Transport margin leakage is a decision problem, not a data problem | Most operators have sufficient data. The issue is that nobody is interrogating the logic driving the decisions that data is supposed to support. |
| Standard TMS reporting cannot surface structural inefficiency | TMS platforms report on outcomes. They do not identify whether the decision rules producing those outcomes are optimal or simply habitual. |
| Live system observation changes what you can find | Deploying diagnostic tools inside a working operation, without disrupting it, reveals cost patterns that retrospective data analysis consistently misses. |
Why Standard Reporting Misses the Real Leaks
Operations directors are not short of dashboards. The problem is that most reporting infrastructure in UK transport is built to describe what happened, not to interrogate why specific decisions were made and whether those decisions were rational given the available options. That distinction matters enormously when you are trying to understand transport margin leakage.
A transport management system will tell you that a vehicle ran 340 miles on Tuesday. It will not tell you that a different allocation decision would have reduced that to 210 miles without missing a single delivery window. The gap between those two numbers is not a reporting failure. It is a decision-making failure, and it is the kind of failure that compounds across every route, every week, every year.
In practice, the organisations that lose the most margin are those that have invested heavily in reporting tools and interpret the absence of obvious anomalies as evidence of efficiency. It is not. It is evidence that their reporting is not asking the right questions.

Silent Cost Leak One: Fleet Allocation Logic
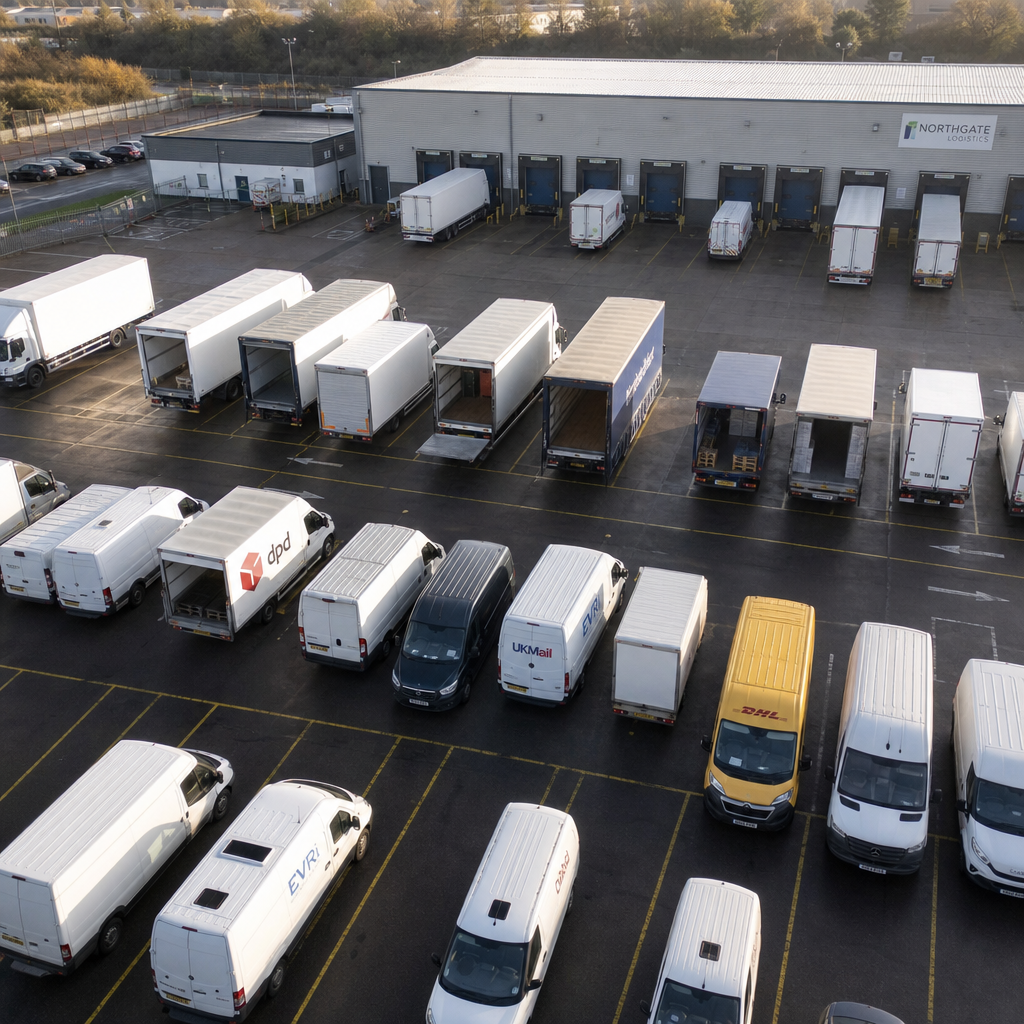
The single most consistent source of hidden transport costs UK operators carry is how they allocate vehicles to routes and loads. In the majority of operations we have assessed, fleet allocation is driven by a combination of historical patterns, driver familiarity, and vehicle availability at the start of a shift. That sounds pragmatic. In practice, it is expensive.
Why Habitual Allocation Costs More Than It Should
When a planner defaults to a specific vehicle type for a specific route because that is what has always been used, they are not making an optimisation decision. They are making an assumption. And assumptions about fleet allocation carry a cost that is almost never measured.
A common mistake is matching a 44-tonne articulated unit to a drop pattern that could be served with a 7.5-tonne rigid at significantly lower cost per mile. The reason it keeps happening is that the decision is made quickly, under time pressure, using mental models built years ago when the route structure or customer requirements were different.
The data consistently shows that when fleet allocation logic is audited against actual demand patterns, over-specification of vehicle type accounts for between 12% and 22% of controllable transport cost on affected routes. That is not a marginal saving. For a fleet operating 40-plus vehicles, it is a material annual figure.
What Correct Allocation Logic Looks Like
Allocation should be driven by load weight, cube, drop sequence, access constraints, and time window requirements, evaluated against the full available fleet at the point of planning. Not by which vehicle a driver prefers or which unit was last parked closest to the loading bay.
This requires making the decision logic explicit, which most operations have never done. The rules exist in people’s heads, not in systems, and that is precisely why they are so difficult to identify and challenge.
Pro tip: Ask your planning team to document the criteria they use when selecting a vehicle for a given route. If the answers are inconsistent across three planners, you have a fleet allocation logic problem that is costing you money right now.
Silent Cost Leak Two: Route Assumption Drift
Routes are built at a point in time based on conditions that exist at that moment: customer locations, delivery windows, depot positions, road infrastructure, and driver hours. Those conditions change. Routes, in most UK transport operations, do not change with them. This is what route assumption drift looks like, and it is one of the most financially damaging forms of hidden transport cost.
How Drift Accumulates Without Anyone Noticing
A customer shifts their delivery window by two hours. The planning team adjusts the sequence for that drop. Nobody reviews whether that adjustment has made the rest of the route suboptimal. A new customer is added three miles off the existing route. A driver is allocated a slight detour. Over eighteen months, the route looks nothing like its original design but is still classified as a single route with a single cost assumption.
According to research published by McKinsey on logistics cost structures, route-level inefficiency driven by outdated assumptions accounts for a disproportionate share of uncontrolled cost in mature transport networks. The longer a network has been operating without a structural route review, the worse the drift tends to be.
“The most expensive routes in any transport network are rarely the longest ones. They are the ones that were designed for a reality that no longer exists.” Source: McKinsey and Company, Logistics and Transport Operations Research
The Compounding Effect of Stale Route Data
Route assumption drift compounds because each incremental change seems small and reasonable. No single adjustment creates an obvious problem. The cumulative effect, across dozens of routes over several years, is a network that is structurally inefficient at a level that standard reporting simply cannot detect because each individual route still appears to be performing within normal parameters.
A proper fleet cost audit that looks at route structure against current operating conditions, not historical baselines, routinely identifies 8-18% of total route cost as attributable to assumption drift alone.
Silent Cost Leak Three: Load Utilisation Gaps
Underutilised load space is money that has already been spent on fuel, driver time, and vehicle wear to move air from one postcode to another. This is one of the oldest problems in transport and one that most operations directors believe they have already solved because their TMS reports average load factors. Average load factors are almost always misleading.

Why Average Load Factors Hide the Real Problem
An operation might report an average load factor of 81% and consider that acceptable. But averages mask distribution. If 30% of movements are running below 60% utilisation, the average is obscuring a significant cost leak. The trips running at 95% do not compensate for the trips running at 55%. They just make the headline number look acceptable.
In practice, load utilisation gaps tend to cluster around specific routes, specific days, or specific customer combinations. They are not random. They are predictable and preventable once the underlying pattern is identified.
The Real Cost of Moving Empty Space
The Department for Transport publishes data on freight transport costs in the UK, and the figures consistently show that the marginal cost of incremental load on an already-planned movement is a fraction of the cost of an additional movement. Every trip running below optimal utilisation is effectively a partial subsidy of a journey that delivers less than it should.
For a 40-vehicle fleet running five days per week, improving average load utilisation from 74% to 84% across underperforming routes typically recovers between £80,000 and £140,000 annually in direct cost. That is without adding a single new customer or changing any commercial terms.
Pro tip: Do not look at average load utilisation across your fleet. Segment it by route, by day of week, and by vehicle type. The leaks are almost always concentrated in specific clusters that averages will not reveal.
Silent Cost Leak Four: Planning Rules Nobody Questions
Every transport operation runs on planning rules. Some of these rules are codified in the TMS. Most exist as institutional knowledge: things planners know you do, or do not do, without necessarily being able to explain why. These rules were created for reasons. The problem is that the reasons are often no longer valid, but the rules persist because nobody has a mechanism to challenge them.
How Outdated Planning Rules Lock In Cost
A common example is a minimum load threshold rule, originally introduced to protect margin on low-density runs, that now prevents planners from combining loads in ways that would reduce overall vehicle movements. The rule made sense when it was written. The operating context has since changed. The rule has not.
Another frequent pattern is a vehicle return time rule that requires all vehicles back at a depot by a specific time, originally driven by a driver hours agreement that has since been renegotiated. Planners still plan to the old constraint because it is embedded in their assumptions, even though the contractual basis for it no longer exists.
Why These Rules Are So Hard to See From the Inside
Planning rules that have existed for years become invisible. They stop feeling like decisions and start feeling like facts about how the operation works. This is why internal reviews rarely surface them. The people closest to the operation are also the people least likely to question assumptions they have absorbed as operational reality.
An external assessment, particularly one that observes decision-making as it happens in a live environment rather than reviewing outputs after the fact, is the only reliable way to identify planning rules that are constraining efficiency without anyone realising it. This is precisely the environment where transport margin leakage lives longest and costs most.
How a Fleet Cost Audit Surfaces What Your TMS Cannot
A traditional fleet cost audit looks at invoices, fuel consumption, maintenance records, and route cost per mile. That is useful background information. It is not a mechanism for finding the kind of structural inefficiency described in the four leaks above.
What actually surfaces hidden transport costs UK operators are carrying is live observation of the decision-making process, not retrospective analysis of outputs. When you watch how a planning decision is made in real time, the logic gaps are visible in a way they never are when you are only reviewing the results of that decision after the fact.
The Five-Day Live Assessment Model
Deploying diagnostic hardware and analytical capacity inside a live transport operation for five consecutive working days, covering actual planning cycles, dispatch decisions, and route execution, produces a fundamentally different quality of finding than any desk-based audit. You see the decision, the constraint that drove it, and the alternative that was not considered, all in sequence.
This approach does not require system replacement. It does not require operational disruption. It runs alongside the existing operation and identifies where the decision logic, not the reporting, is generating unnecessary cost. The findings are specific enough to quantify, which is why it is possible to put a minimum savings guarantee of £100,000 on the outcome before the work begins.
What Differentiates This From Standard Consultancy Output
Most transport consultancy delivers a report describing what the data shows. The client is left to interpret what that means for their planning decisions. A live assessment model delivers findings at the decision level: this specific allocation logic, this specific route assumption, this specific planning rule is costing you this specific amount, and here is exactly what needs to change to recover it.
That is a materially different kind of finding, and it is the only kind that directly addresses the four silent cost leaks described in this article.
Comparison of Approaches to Identifying Transport Margin Leakage
| Approach | What It Can Find | What It Misses |
|---|---|---|
| Internal TMS Reporting Review | Outcome anomalies, cost-per-mile variances, delivery failure rates | Decision logic failures, planning rule constraints, allocation assumption drift, load utilisation clustering |
| Desk-Based Consultancy Audit | Benchmark comparisons, high-level route cost analysis, fleet utilisation averages | Live planning behaviour, real-time decision constraints, institutional planning rules embedded in team knowledge rather than systems |
| Live System Observation with Proprietary Hardware | Real-time decision logic gaps, route assumption drift against current conditions, specific allocation errors, planning rules that constrain efficiency | Historical trend data prior to the observation window, but this is supplemented with retrospective route and cost data analysis |
Frequently Asked Questions
What is the typical annual value of hidden transport costs in a mid-size UK fleet operation?
For a fleet of 30 to 60 vehicles operating across a standard five-day week in the UK, the combined value of the four silent cost leaks, covering fleet allocation logic, route assumption drift, load utilisation gaps, and outdated planning rules, typically falls between £100,000 and £350,000 annually. The figure depends heavily on how long the operation has been running without a structural decision-logic review, not on fleet size alone.
Why do transport management systems not identify these cost leaks automatically?
TMS platforms are built to execute and record decisions, not to evaluate whether those decisions were the most cost-efficient options available. They report on outcomes within the parameters set by the planning rules and allocation logic they have been given. If those rules and that logic are suboptimal, the TMS will execute suboptimal decisions efficiently and report on them accurately. The inefficiency is invisible to the system because the system is not designed to question its own operating parameters.
How does route assumption drift develop without planners noticing it?
Route assumption drift happens incrementally. Each individual change to a route, adding a stop, adjusting a window, rerouting around a road closure, seems minor and reasonable at the time. Because no single change is large enough to trigger a formal review, the cumulative effect of dozens of small changes over months or years is never assessed against the original route design or against a current optimal alternative. The route is still functioning, so it is treated as working, even when it is significantly more expensive than it needs to be.
What does a live transport assessment actually involve operationally?
A live assessment deploys diagnostic hardware within the existing transport operation and observes planning decisions, dispatch processes, and route execution as they happen in real time across a defined period, typically five working days. There is no requirement to change systems, halt operations, or alter planning behaviour. The assessment runs alongside the operation and captures the decision logic, not just the outcomes, which is the only way to identify structural cost leaks at the planning rule and allocation logic level.
Is transport margin leakage always caused by poor planning, or are there other drivers?
Poor planning in the traditional sense, meaning planners making bad decisions, is rarely the primary cause. The more common driver is rational planning within irrational constraints. Planners are following rules and applying logic that made sense when it was established. The problem is that the constraints they are working within are themselves suboptimal, either because they are outdated, because they were never based on rigorous analysis in the first place, or because the operating environment has changed in ways that the rules have not tracked. This is a structural problem, not a competence problem.
How quickly can identified savings from a fleet cost audit be realised?
The majority of savings identified through a decision-logic audit do not require capital investment or system changes. Changes to fleet allocation rules, route restructuring against current conditions, and removal of outdated planning constraints can typically be implemented within four to eight weeks of findings being delivered. Load utilisation improvements that require schedule restructuring may take a full planning cycle, typically eight to twelve weeks, to fully realise. The point is that these are operational changes, not infrastructure changes, which means the payback timeline is short relative to the annual value recovered.
If you are an operations director who has recognised any of these patterns in your own network, we would welcome your perspective on which of the four leaks tends to be hardest to surface internally and why.
References
- UK Government freight transport statistics and cost data published by the Department for Transport
- McKinsey and Company research on logistics network efficiency and transport cost structure
- Statista data on UK road freight costs, fleet utilisation benchmarks, and transport industry operating margins
- Forbes analysis of supply chain cost leakage and operational efficiency in logistics businesses
- UK Government regulatory guidance on fleet operations, vehicle standards, and transport planning compliance