Most transport directors who commission a technology audit find the same uncomfortable truth: the dashboards work fine. The GPS is accurate. The TMS is processing data. The problem is not the technology. The problem is the logic baked into how decisions get made, day after day, at the planning desk, in the depot, and across the fleet. Transport decision-making inefficiency quietly costs operations six and sometimes seven figures annually, yet it rarely shows up on a software vendor’s diagnostic report. This article identifies five specific signs that your operation is bleeding cost through decision-making failures, not system failures.
Table of Contents
- Why Decision-Making Fails Before Technology Does
- Quick Takeaways
- Sign 1: Planning Rules That Have Never Been Challenged
- Sign 2: Fleet Allocation Logic Is Habit, Not Analysis
- Sign 3: Route Assumptions Outlive the Data That Created Them
- Sign 4: Load Utilisation Is Reported, Not Interrogated
- Sign 5: Cost Leaks Are Treated as Acceptable Variance
- Comparing Approaches to Diagnosing Fleet Management Problems
- Frequently Asked Questions
- References
Why Decision-Making Fails Before Technology Does
There is a bias in the transport and logistics industry toward attributing operational problems to tools. When a route performs poorly, the instinct is to question the routing software. When a fleet runs over budget, the conversation turns to telematics providers. This instinct is understandable, but the data consistently shows it is wrong.
In practice, the most expensive inefficiencies in transport operations are not caused by broken systems. They are caused by broken assumptions that have been encoded into daily planning behaviour. Those assumptions are invisible until someone examines the actual decision logic, not just the output reports.
McKinsey research on operational decision-making consistently finds that organisations lose more value through poor decision processes than through poor tools. The tools execute whatever logic they are given. If the logic is flawed, the execution is flawless and expensive.
Quick Takeaways
| Key Insight | Explanation |
|---|---|
| Planning rules erode in value over time | Rules set two or three years ago reflect a network that no longer exists. They compound cost silently until someone tests them against live conditions. |
| Fleet allocation driven by habit creates structural waste | When vehicles are assigned based on historical patterns rather than current demand modelling, overcapacity becomes a fixed cost rather than a managed variable. |
| Route assumptions persist long after conditions change | Road changes, customer profile shifts, and volume redistributions make old route logic expensive to run but difficult to spot from KPI reports alone. |
| Load utilisation metrics are frequently misleading | A 90% average load fill can mask routes running at 65% that are subsidised by routes running at 110%. Averages hide logistics cost leaks. |
| Variance acceptance is a cost-accounting trap | When operations teams classify recurring overspend as acceptable variance, it removes the incentive to diagnose the underlying decision error. |
| Technology replacement does not fix decision logic | Migrating to a new TMS or routing platform replicates existing decision rules unless those rules are audited first. The new system runs the same bad logic faster. |
| Live operational data reveals what historical reports cannot | Five days of hardware-led observation inside a live operation surfaces decision patterns that months of report analysis will not, because it captures what actually happens rather than what is recorded. |
Sign 1: Planning Rules That Have Never Been Challenged
Every transport operation runs on a set of planning rules. Shift start times, vehicle type allocations per region, minimum load thresholds before a route runs, maximum drive times before a break is scheduled. These rules were set at a point in time, by people who understood the network as it existed then.
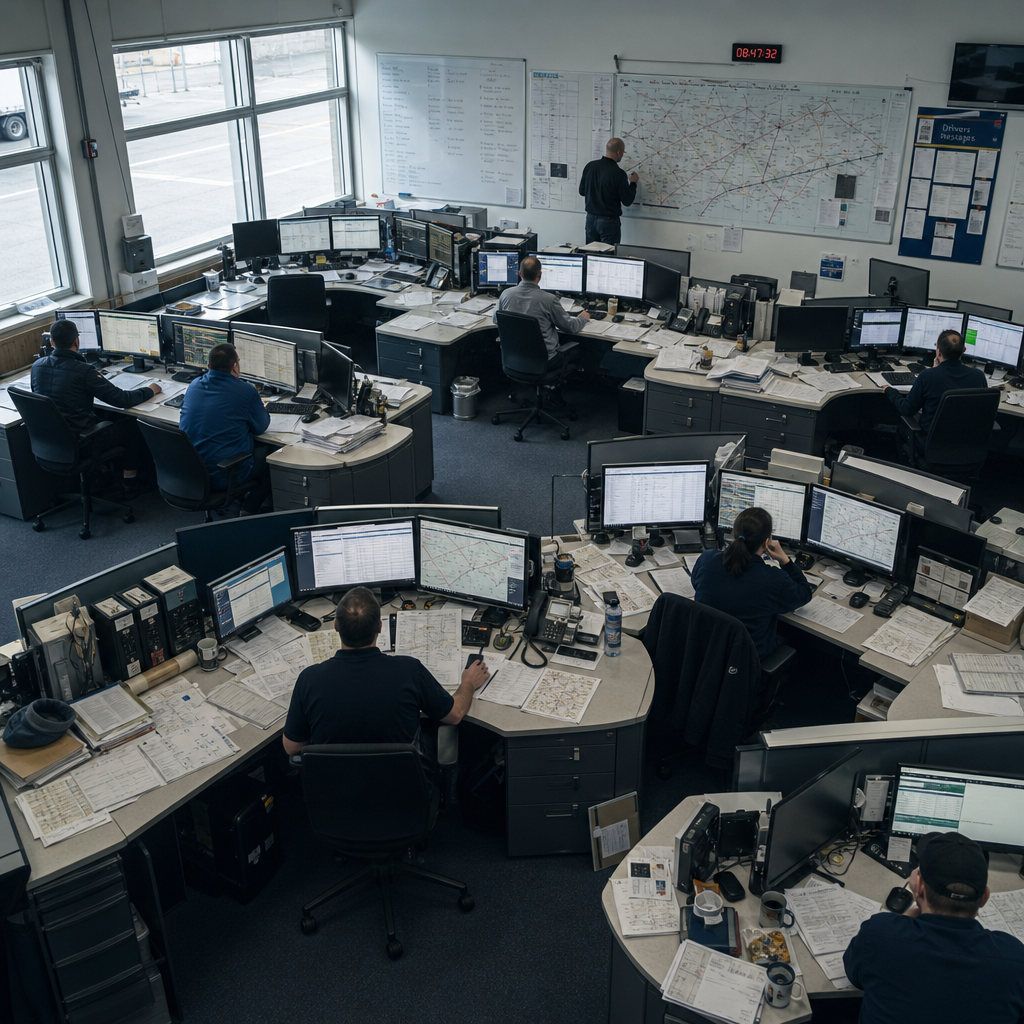
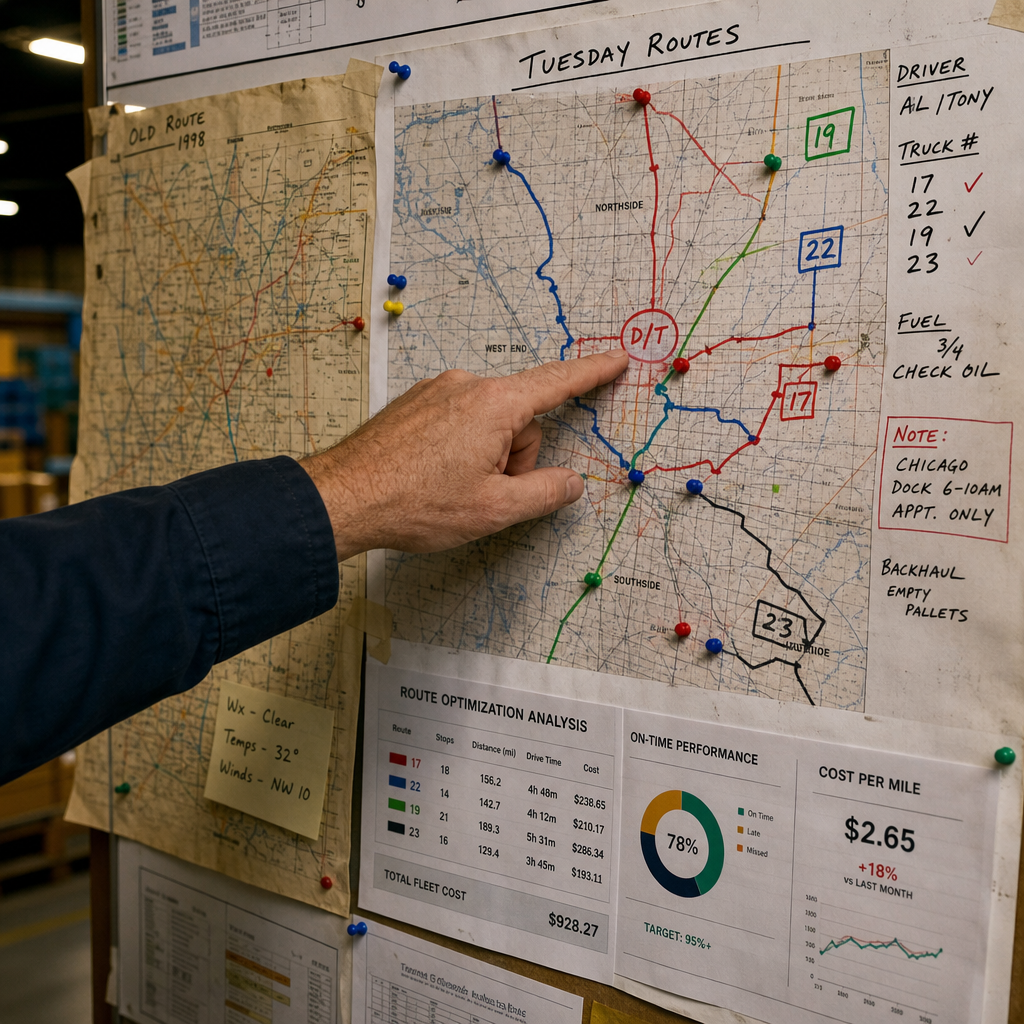
The problem is that most of these rules are never reviewed. They become embedded in the planning software, in the briefing documents, and in the institutional knowledge of the planning team. A common mistake is treating a planning rule as a permanent constraint when it is actually a time-bound assumption.
How outdated rules create recurring cost
When a rule was set three years ago based on a customer mix that no longer exists, or a vehicle specification that has since changed, the operation continues to optimise around a false constraint. Planners hit their KPIs because they are measured against the rule, not against what the operation could achieve without it.
In practice, a single outdated minimum load rule can prevent route consolidation that would eliminate one vehicle movement per day across a region. At typical transport costs in the UK, that represents between £40,000 and £80,000 per year in avoidable expenditure. Multiply that by three or four unreviewed rules and the annual figure becomes significant.
Pro tip: Ask your planning team to list every decision rule they apply daily and date when each rule was last formally reviewed. If that date is more than 18 months ago, treat the rule as a candidate for live testing, not a given.
Sign 2: Fleet Allocation Logic Is Habit, Not Analysis
Fleet allocation is where fleet management problems are most likely to express themselves as cost overruns that look like operational variance. When vehicles are assigned to routes, regions, or shift patterns based on what was done last week rather than what the current demand profile requires, overcapacity becomes structural.
This is not an argument for reducing fleet size without analysis. It is an argument for understanding whether the fleet you are running is configured for the operation you have now, or for an operation that existed when the current allocation model was built.
What habit-driven allocation looks like in practice
The most common pattern is vehicle class mismatch. A large rigid is allocated to a multi-drop urban route because it always has been, even though the average drop volume has decreased and a smaller vehicle would complete the same route with lower fuel cost, lower driver time, and higher flexibility. The planner does not flag this because the route is covered and the KPI is green.
A second pattern is fleet idle time that is never interrogated. If a depot runs 12 vehicles and 9 complete their routes by 14:00 with three sitting until the end of shift, that gap is a decision-making failure, not a scheduling one. The schedule reflects the decision logic. The decision logic is what needs to change.
“The biggest source of waste in transport operations is not fuel or labour. It is the quiet replication of yesterday’s decisions into tomorrow’s plan.” – Flow Dynamics operational audit findings, synthesised across 40-plus UK transport operations
Sign 3: Route Assumptions Outlive the Data That Created Them
Routes are designed at a moment in time using customer locations, volume expectations, road network data, and time window requirements that exist at that moment. All of those inputs change. Customer volumes shift. New customers are added while others reduce frequency. Road infrastructure changes. Time window requirements from customers evolve.
What does not always change is the route. Logistics cost leaks are frequently embedded in routes that were optimised years ago and have been running ever since with incremental adjustments rather than fundamental review.
Why route reviews are avoided and what that costs
Route restructuring is operationally disruptive. It involves driver briefings, customer communication, and a period of instability that operations directors are understandably reluctant to create. So routes persist. The cost of that persistence is rarely calculated directly because the route continues to function. Deliveries are made. KPIs are met. But the route is running at a higher cost per drop than a re-optimised version would achieve.
In practice, a transport network that has not had a zero-based route review in more than two years is almost certainly carrying between 8% and 15% avoidable route cost. For an operation spending £2 million annually on transport, that range represents £160,000 to £300,000 in addressable waste that sits below the threshold of normal management reporting.
Pro tip: Do not confuse a route optimisation software update with a route assumption review. The software will optimise within the parameters you give it. If the parameters include outdated customer profiles or volume estimates, the software will produce an optimised version of an outdated plan.
Sign 4: Load Utilisation Is Reported, Not Interrogated
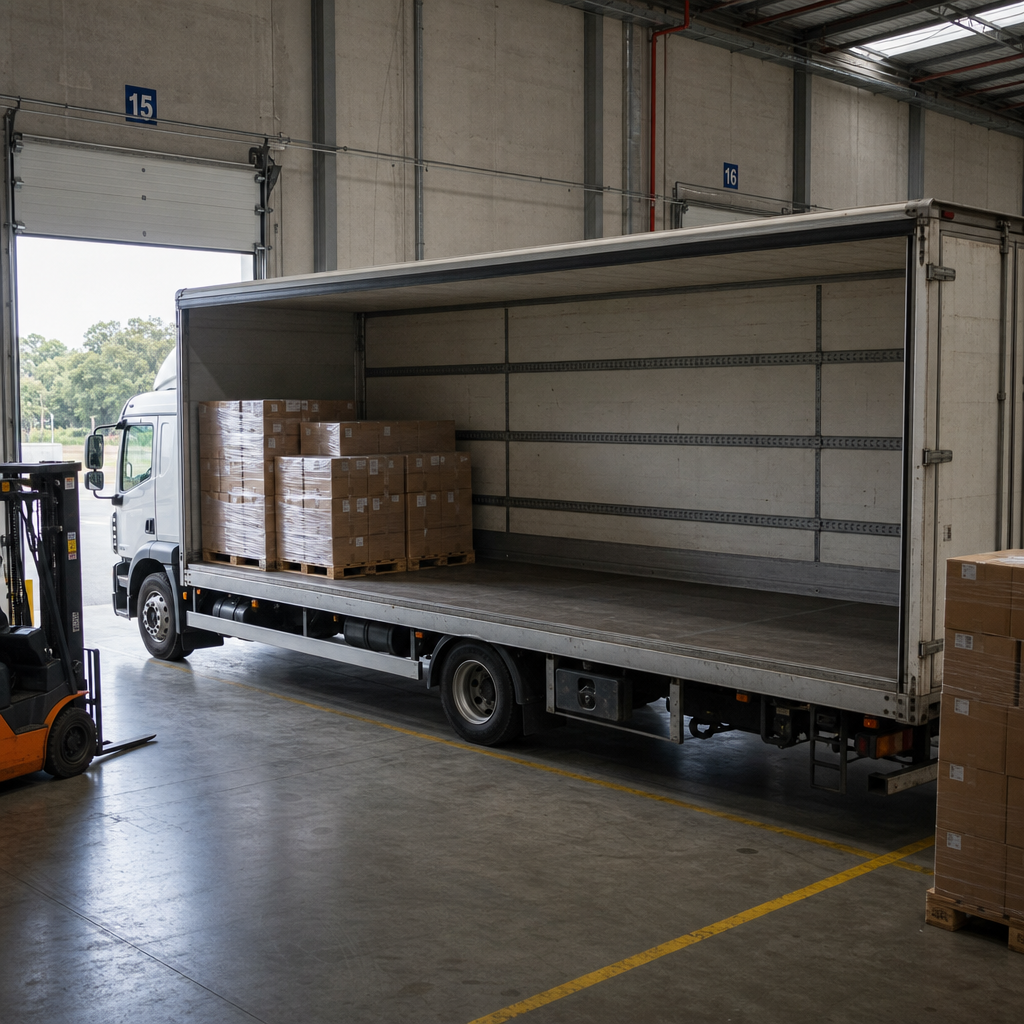
Load utilisation is one of the most reported metrics in transport operations and one of the least interrogated. The standard report shows an average fill rate across the fleet. That average is almost always presented as a positive, and almost always masks a distribution of performance that tells a very different story.
A network averaging 85% fill rate can contain routes running consistently at 60% fill, routes running over legal weight limits that are absorbing volume pushed off the underloaded routes, and routes where the planning logic is creating artificial load caps that prevent consolidation.
Where load utilisation metrics hide decision failures
The decision failure is not in the loading operation. Loaders load what they are given. The failure is in the planning logic that determines what gets assigned to which vehicle on which route. If the planning logic is using capacity rules that do not reflect actual vehicle certification, or time window constraints that are more conservative than the customer actually requires, load utilisation will chronically underperform without that underperformance ever appearing in a KPI report.
The data consistently shows that operations with average reported fill rates above 80% often have individual route fill rates ranging from 55% to 95%. The 55% routes represent direct cost leakage. Each one is a vehicle and driver running at a cost that the load does not justify. The reason those routes persist is that the decision logic that created them has never been examined at the route level.
Sign 5: Cost Leaks Are Treated as Acceptable Variance
This is the sign that is hardest to see from inside the operation. When a cost category consistently runs 5% to 8% over budget, month after month, the first response is usually to adjust the budget rather than to diagnose the decision that is creating the overspend. The variance becomes the new baseline. The underlying decision error becomes permanent.
This is not a criticism of operations teams. It is a structural problem with how transport cost management is typically reported. When KPIs are set against budgets and budgets absorb variance, the signal that would trigger a decision-making review never gets generated.
The difference between operational variance and decision-making failure
True operational variance is unpredictable. Traffic disruption, weather, vehicle breakdown. These create cost spikes that are genuinely variable. Decision-making failure creates consistent overspend that appears in the same cost categories, on the same routes, in the same planning periods, week after week.
The distinction matters because variance cannot be managed through better decisions. But a recurring cost pattern can. When a fleet consistently spends more on fuel on a specific route cluster, or consistently runs overtime on a specific shift pattern, that is a decision trace. It points to a planning rule, an allocation choice, or a route assumption that is generating cost in a predictable and therefore addressable way.
Operations that have not separated genuine variance from decision-originated cost patterns are systematically underestimating their addressable savings. In a typical UK transport operation spending between £3 million and £10 million annually on transport costs, the decision-originated share of apparent variance is rarely less than £100,000 and frequently exceeds £300,000.
Comparing Approaches to Diagnosing Fleet Management Problems
Not all diagnostic approaches surface decision-making failures equally. The method used to identify transport inefficiency determines what type of problem gets found. Here is a direct comparison of the three main approaches used by operations directors and the consulting firms they engage.
| Approach | What It Finds | What It Misses |
|---|---|---|
| Historical data and KPI report analysis | Trends in reported performance, budget variances, route-level cost summaries | Decision logic errors that are invisible in aggregated reports. Cannot distinguish genuine variance from decision-originated cost patterns. |
| Software platform audit or TMS review | Configuration errors, underused features, integration gaps between systems | Planning rules and allocation habits that are applied outside the system, or that are correctly implemented within the system but are themselves flawed assumptions. |
| Live operational observation with proprietary hardware deployed in the live transport system | Actual decision behaviour at the planning desk and in the depot, real load patterns versus reported load patterns, route execution versus route plan | Less effective at identifying systemic accounting issues outside the transport operation itself. |
The third approach is what Flow Dynamics deploys. Five days of hardware observation within live transport systems surfaces decision patterns that months of report analysis cannot, because it captures what planners and allocators actually do rather than what the system records. The result is a specific, costed set of decision changes rather than a set of reporting recommendations.
Frequently Asked Questions
How do I know if my transport operation has a decision-making problem rather than a technology problem?
The clearest signal is when you have replaced or upgraded technology and the cost structure has not improved. If your TMS, routing software, or telematics platform is functioning as specified but operational costs remain stubbornly high, the problem is the logic being fed into those systems, not the systems themselves. Decision-making problems also tend to produce consistent, predictable cost patterns rather than spikes.
What is the most common logistics cost leak in UK transport operations?
In practice, the most common single source of avoidable cost is fleet allocation driven by habit rather than demand analysis. Vehicles assigned to routes or regions based on historical patterns rather than current requirements create structural overcapacity that compounds across every operating week. The second most common is outdated planning rules that have never been formally reviewed against current network conditions.
Can these decision-making problems be fixed without replacing existing systems?
Yes, and this is a critical point. The decision logic that generates cost leaks sits in the planning process and in the rules applied by planning teams, not in the technology itself. Fixing it requires identifying which specific decisions are creating cost, then changing the inputs to those decisions. That does not require a new TMS, a new routing platform, or any operational disruption beyond the diagnostic period.
How long does it take to identify and quantify decision-making inefficiency in a live transport operation?
Five days of live observation with the right diagnostic hardware is sufficient to identify the primary decision failures and model the annual cost impact. The five-day window is not arbitrary. It covers a full working week, which captures the complete pattern of planning decisions including end-of-week consolidation logic and start-of-week allocation resets. Longer observation periods rarely change the primary findings.
What size of transport operation typically has addressable decision-making savings above £100,000?
Any UK transport operation spending above £1.5 million annually on transport costs is a realistic candidate for savings of at least £100,000 through decision logic improvement. The percentage of addressable waste relative to total spend tends to decrease as operations scale, but the absolute value increases. A £10 million transport spend with a 5% decision-originated waste rate represents £500,000 in savings. Operations that have never conducted a decision-focused audit rather than a reporting-focused review are the strongest candidates.
Why do standard consulting reviews miss decision-making problems?
Most consulting reviews are structured around data that has already been processed and reported. They analyse what the system recorded, not what the planner decided. Because decision errors happen before the system records anything, they are invisible to report-based analysis. A review that never observes a planner working, never watches a vehicle being loaded, and never tracks the gap between the planned route and the executed route will not find decision-level cost sources.
If you are seeing any of these five patterns in your own operation, share what you have observed in practice and what approaches you have tried to address them.
References
- McKinsey and Company research on operational decision-making and organisational performance
- Statista data on UK logistics and transport sector cost structures and operational benchmarks
- Forbes analysis of supply chain inefficiency and the cost of poor planning decisions in logistics
- UK Government transport and logistics industry data including fleet utilisation and freight movement statistics