Most transport operations directors assume that fixing cost inefficiencies means replacing software, retraining staff, or halting normal operations for weeks. That assumption is wrong, and it is costing UK fleets hundreds of thousands of pounds per year in avoidable waste. A properly executed non-disruptive fleet audit requires none of those things. It works inside your live environment, reads your real decisions, and surfaces the specific logic failures draining your budget, without touching your TMS, without changing your routes mid-cycle, and without your planners spending a single extra hour in meetings. This article explains exactly what that process looks like, step by step, so you can assess it against what you have been told by other consultants.
Table of Contents
- Quick Takeaways
- Why Most Fleet Diagnostics Are Disruptive by Design
- What a Non-Disruptive Fleet Audit Actually Involves
- The Five-Day Live Environment Diagnostic
- What the Data Consistently Shows
- How This Compares to Other Approaches
- The Decision Logic Problem That Reporting Tools Miss
- What Happens After the Diagnostic
- Frequently Asked Questions
- References
Quick Takeaways
| Key Insight | Explanation |
|---|---|
| No system replacement needed | A legitimate fleet diagnostic deploys proprietary hardware into your live operation. It reads your existing systems without replacing or integrating with them. |
| Five days is enough time | A focused 5-day live deployment captures enough real operational decision data to identify meaningful cost leaks, typically at least £100,000 in annualised savings. |
| The problem is decision logic, not reporting | Most fleet cost waste comes from planning assumptions and allocation rules, not from missing dashboards. Adding more reports does not fix the underlying logic. |
| Operations continue as normal | A non-disruptive approach means drivers, planners, and dispatchers keep doing their jobs. The diagnostic observes, it does not interrupt. |
| Fleet allocation is the most common cost leak | In practice, the largest savings are almost always found in how vehicles are allocated against load profiles, not in route geometry or fuel management. |
| No fee unless savings are confirmed | The engagement model at Flow Dynamics is built around verified outcomes. If the diagnostic does not identify at least £100,000 in realistic annual savings, the client pays nothing. |
| Transport optimisation consulting UK requires sector specificity | Generic supply chain consultants often apply frameworks from retail or manufacturing to transport operations. The diagnostic must be built around live fleet decision data, not theoretical models. |
Why Most Fleet Diagnostics Are Disruptive by Design
The standard consulting approach to fleet diagnostics is built around data extraction. A consultant arrives, requests data exports from your TMS, your ERP, your telematics platform, and your fuel management system. They spend weeks cleaning and reconciling that data. Then they produce a report based on historical averages. By the time you receive it, the operational reality has shifted.
This model is disruptive in two ways. First, it pulls your team’s time into data gathering exercises that have nothing to do with moving freight. Second, and more damaging, it produces findings based on what your systems recorded, not on what your planners actually decided in the moment. Those are very different things.
Reporting data and decision data are not the same. Your TMS records what happened. It does not record why a planner chose a specific vehicle for a load, why a route assumption was left unchanged for three years, or why a scheduling rule designed for a different customer profile is still being applied to a contract that no longer matches it.
A common mistake is assuming that better dashboards will fix planning problems. They will not. If the logic behind the decision is flawed, showing that logic in a cleaner chart does not make it less costly.
Pro tip: Before engaging any transport optimisation consultant, ask them specifically what they will observe versus what they will extract. If the answer is primarily extraction and analysis, expect findings that are months out of date by the time they reach your desk.
What a Non-Disruptive Fleet Audit Actually Involves
A genuine non-disruptive fleet audit is built around observation of live decisions, not interrogation of historical data. The mechanism is hardware deployment, not software integration. That distinction matters enormously in practice.
Proprietary hardware is placed within the live transport operation. It reads decision signals as they occur, including vehicle allocation choices, load planning outputs, routing selections, and scheduling adjustments. It does not require API access to your TMS. It does not require your IT team to build an integration. It does not sit in a staging environment analysing dummy data.
The result is a picture of your operation as it actually runs, including the informal overrides, the workarounds, and the planning assumptions that have never been formally documented but are baked into every shift.
What the hardware reads and what it ignores
The hardware is looking for cost signals in decision patterns, not for compliance violations or driver behaviour. This is not telematics in the conventional sense. It is not measuring speed, idling time, or harsh braking. It is reading the economic logic of operational choices at the planning level.
Specifically, it tracks how load profiles are matched against vehicle capacity over time, how routing assumptions diverge from actual travel conditions, and where scheduling rules create systematic underutilisation or over-allocation. Those are the three areas where the largest cost leaks consistently appear in UK fleet operations.

The Five-Day Live Environment Diagnostic
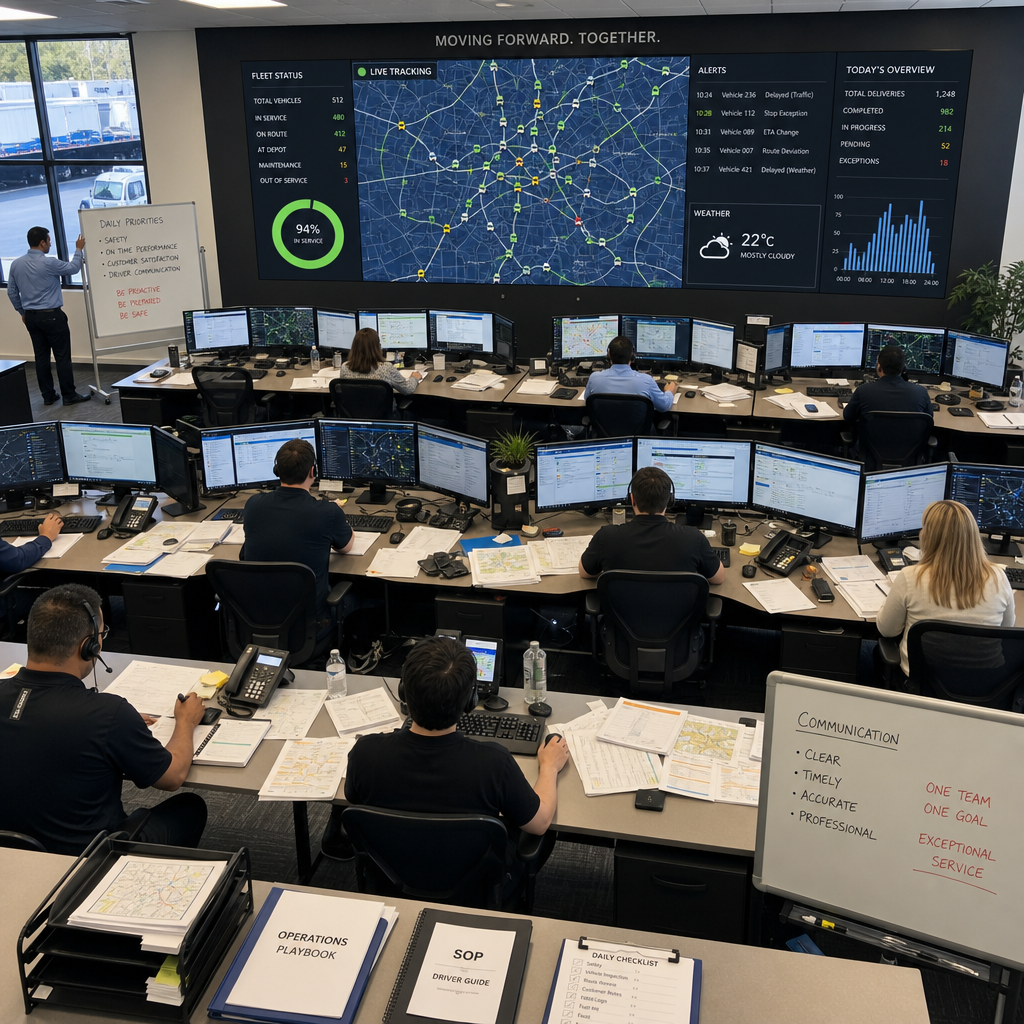
Five days is not an arbitrary timeframe. It is the minimum window required to capture a representative sample of real operational decisions across a working week, including the variance between start-of-week planning logic and end-of-week reactive adjustments. Those adjustments are where a disproportionate amount of cost waste lives.
Day one and two: baseline capture
The first two days establish what normal looks like in your operation. The hardware reads allocation decisions across the fleet without any interaction with planners or dispatchers. This is deliberate. The moment a consultant starts asking questions, operational behaviour changes. Baseline capture must happen passively.
During this phase, the system is building a picture of your standard load-to-vehicle matching logic, your default route assumptions, and the frequency with which manual overrides occur to planning system outputs.
Day three: variance identification
By day three, the system has enough baseline data to start identifying where decisions diverge from the most cost-efficient path. This is not about theoretical optimisation. It is about identifying the specific rules or assumptions that are consistently producing worse economic outcomes than alternatives that already exist within your own operation.
In practice, the most valuable findings at this stage involve routes or allocation patterns that a minority of planners are already handling more efficiently than the majority. The gap between your best planner’s decisions and your average planner’s decisions is often worth tens of thousands of pounds per year on its own.
Day four and five: quantification and validation
The final two days convert the identified variances into financially quantified savings estimates. This is where the £100,000 minimum threshold is either confirmed or not. The quantification is based on real volume data from your actual operation, not on benchmarks from comparable businesses.
Pro tip: Ask any consultant presenting savings estimates whether those figures are based on your actual load volumes and route frequencies or on industry benchmarks applied to your fleet size. Benchmark-based estimates routinely overstate achievable savings by 30 to 60 percent.
What the Data Consistently Shows
Across transport operations reviewed by Flow Dynamics, three patterns appear with such regularity that they can be described as structural features of UK fleet management rather than individual operational failures.
First, fleet allocation logic is almost always based on capacity rules that are three to five years out of date. A vehicle allocation rule designed for a customer contract that has since changed in volume, frequency, or delivery window is still being applied because no one has formally reviewed it. The cost of that misalignment compounds daily.
Second, route assumptions embedded in planning systems are rarely challenged. The data consistently shows that a significant proportion of routes in active use were validated when fuel costs, congestion patterns, or customer locations were materially different. The routes are not wrong in absolute terms. They are wrong relative to the current operating environment.
Third, and most importantly for operations directors, the savings are almost never visible in standard reporting. Your KPI dashboards are measuring performance against current plans. They are not measuring the cost of planning assumptions that could be changed.
“The biggest inefficiencies in logistics are not the ones showing up as red flags in your reporting. They are the ones that your reporting system considers normal.” – Flow Dynamics diagnostic findings summary, based on multi-client operational review.
How This Compares to Other Approaches
It is worth being direct about how a live-environment hardware-based diagnostic compares to the alternatives that operations directors are typically offered by transport optimisation consulting firms in the UK market.
| Approach | What It Measures | Disruption to Operations |
|---|---|---|
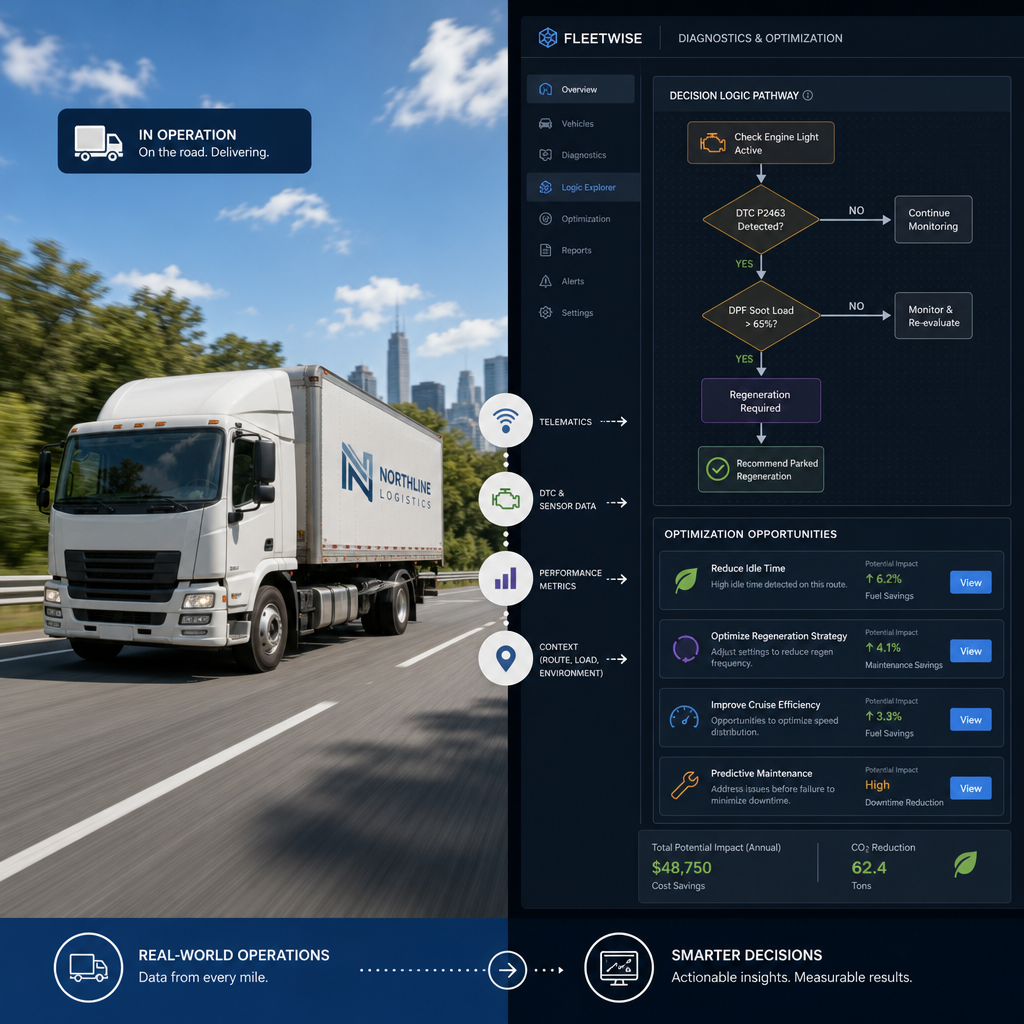
| Live hardware diagnostic (Flow Dynamics model) | Real-time decision logic, allocation patterns, and planning rule effectiveness across a working week | None. Hardware deployed passively. No planner time required. No IT integration needed. |
| TMS data extraction and analysis (standard consulting model) | Historical transaction records, route logs, and fuel consumption data from system exports | Moderate. Requires significant internal resource to gather, validate, and export data across systems. |
| Software-led optimisation platform (SaaS approach) | Route geometry, estimated time calculations, and load matching against a new system’s logic | High. Requires system integration or replacement, staff retraining, and a transition period with operational risk. |
The SaaS optimisation approach, offered by platforms that position themselves as end-to-end route optimisation solutions, requires your operation to conform to the software’s logic. That is the inverse of what a diagnostic should do. A diagnostic should identify where your current logic is costing you money, not replace it wholesale with a new set of assumptions that may or may not fit your operation.
The data extraction model used by many traditional management consultancies is not without value, but it has a fundamental limitation. It can tell you what happened. It cannot tell you why specific decisions were made, and it cannot identify the informal planning rules that never make it into system data.
The Decision Logic Problem That Reporting Tools Miss
Every transport operation runs on two sets of rules. The first set is documented: the routing parameters in your TMS, the vehicle allocation logic in your planning system, the customer service level agreements that constrain your scheduling. The second set is undocumented: the informal rules that planners apply based on experience, habit, or historical workarounds that were never revisited.
The fleet diagnostic process at the level that produces genuine financial impact has to capture both sets. Reporting tools only see the first set, because they can only record what the system was told to do. They cannot record what a planner decided to override, ignore, or compensate for based on knowledge that exists only in their head.
Why planner workarounds are your most valuable data
In practice, planner workarounds fall into two categories. The first category represents genuine operational intelligence: a planner who knows that a specific load profile on a Tuesday runs 12 percent more efficiently with a particular vehicle configuration is applying knowledge that your system has never captured. That knowledge is worth formalising.
The second category represents accumulated cost. A workaround that made sense in 2019 because a customer’s delivery window was different, or because a particular road was under construction, is still being applied in 2025 because no one has formally reviewed it. Those workarounds are invisible in your reporting and systematically expensive.
A live diagnostic captures both. Standard reporting captures neither.
What Happens After the Diagnostic
The output of a five-day live diagnostic is not a report recommending a system replacement. That is the point. The findings are specific to your current operation, expressed in terms of the exact decision changes that would produce identified savings, and implementable within your existing systems and team structure.
A common objection at this stage is that implementing recommendations will still require operational change and therefore disruption. That is partially true, but it misunderstands the nature of the changes involved. Revising a vehicle allocation rule in your planning system takes hours, not weeks. Updating a route assumption takes a planner briefing, not a retraining programme. Removing a scheduling rule that is no longer fit for purpose does not require a new platform.
The changes that generate £100,000 or more in annual savings are almost always changes to parameters and rules within systems you already have, not replacements of those systems. This is the core argument for transport optimisation consulting built around diagnostic accuracy rather than technology sales.
Operations directors who have been through this process consistently report that the most surprising aspect is not the size of the savings identified. It is that the changes required to achieve those savings are far smaller than they expected based on the scale of the problem.
Frequently Asked Questions
How is a non-disruptive fleet audit different from a telematics review?
A telematics review analyses driver behaviour data: speed, idling, harsh braking, fuel consumption per vehicle. A non-disruptive fleet audit analyses planning and allocation decision logic at the operational level. The two address entirely different cost categories. Telematics savings are typically incremental. Allocation and routing logic savings are typically structural and significantly larger.
Will our IT team need to be involved in the diagnostic?
No. The hardware deployment used in a live-environment diagnostic does not require API integration, system access, or any involvement from your IT department. It reads operational decision signals passively. This is one of the primary differences from software-led optimisation platforms, which require IT resource, integration work, and often security approval processes that delay the engagement by weeks or months.
What types of fleets benefit most from this kind of diagnostic?
Operations with mixed fleet types, multiple customer contracts with different service requirements, or planning functions that have grown through acquisition or contract expansion benefit most. The more complex the allocation logic, the more likely it contains rules that are no longer fit for purpose. Single-vehicle-type, single-customer operations with stable and simple routing tend to have fewer decision logic gaps, though they are not immune.
How confident should we be in savings estimates produced after just five days?
Savings estimates produced from live decision data are materially more reliable than those produced from historical data analysis, because they reflect actual current operational behaviour rather than averaged historical patterns. That said, estimates should always be presented with a range and a clear statement of the assumptions underlying the quantification. At Flow Dynamics, the minimum threshold of £100,000 in confirmed realistic annual savings is a conservative floor, not an optimistic ceiling. If that threshold cannot be confirmed, no fee is charged.
What is the biggest risk with this kind of engagement?
The most common risk is not the diagnostic itself. It is the implementation phase. Identified savings are only realised if the recommended changes to planning logic, allocation rules, or routing assumptions are actually implemented and sustained. Organisations with strong change management discipline at the operations director level consistently realise a higher proportion of identified savings than those where implementation is delegated without clear ownership.
How does this approach differ from what firms like Scala Group or SCCG offer?
Firms like Scala Group and SCCG typically position their value around programme management, technology selection, or supply chain strategy work that spans months of engagement. The diagnostic model at Flow Dynamics is narrower in scope and faster in delivery, specifically because it targets decision logic cost leaks rather than broader operational transformation. If your goal is to identify and remove specific cost inefficiencies without a lengthy consulting engagement, a targeted live diagnostic produces findings in days rather than quarters.
Have you been through a fleet diagnostic that either confirmed or contradicted these findings? Share what you encountered, because the gap between how these engagements are sold and how they actually run in practice is something more operations directors should be talking about openly.
References
- McKinsey and Company: research and insights on operational efficiency and logistics cost reduction in complex supply chains
- Statista: UK transport and logistics industry statistics including fleet operating costs and market size data
- UK Government Department for Transport: official data on commercial vehicle operations, fleet regulations, and freight industry benchmarks
- Forbes: analysis of supply chain consulting trends and operational cost management strategies for logistics executives
- Ahrefs Blog: used here for its data-driven content methodology, referenced as a standard for evidence-based industry reporting practices